2024 Summer Research Reading
2024.06.07Medium Post, linkHow to Build a RAG System with a Self-Querying Retriever in LangChain
How to Build a RAG System with a Self-Querying Retriever in LangChain
Original post: click here
IdeaWhy can’t I use natural language to query a movie based more on the vibe or the substance of a movie, rather than just a title or actor?
e.g. search: I liked “Everything Everywhere all at Once”, give me a similar film, but darker.
Action: Build Film SearchRAG-based system, takes a user’s query, embeds it, and does a similarity search to find similar films.Different to vanilla RAG: using self-querying retriever.
Ability: allow filtering movies by their meta ...
Organizations to Publish Papers
ACLThe Association for Computational Linguistics (ACL) is a scientific and professional organization for people working on natural language processing.Paper Submit DDL: mid Feb. per year
EMNLPEmpirical Methods in Natural Language Processing (EMNLP) is a leading conference in the area of natural language processing and artificial intelligence.
IMCLInternational Making Cities Livable (IMCL)The mission of the IMCL has always been to raise awareness, through conferences and publications, of the ef ...
Number of Clusters in K-means
K-Means: have k clusters, first randomly choose k centroids, then include to each cluster by smallest distance, calculate the mean of the points in each cluster as the new centroid.
How will you define the number of clusters in a clustering algorithm?
Why important? Clustering, a technique used to group together objects with similar characteristics.
Clustering algorithms are the methods that group these data points into different clusters based on their similarities.
Book Notes-Be the Outlier How to Ace DS Interview
Book: Be the Outlier How to Ace Data Science Interview Notes.
Chapter 4 Modeling and Machine Learning QuestionsPractice Question 1 — Overfitting in Predictive Models
Practice Question 2 — Number of Clusters in K-means
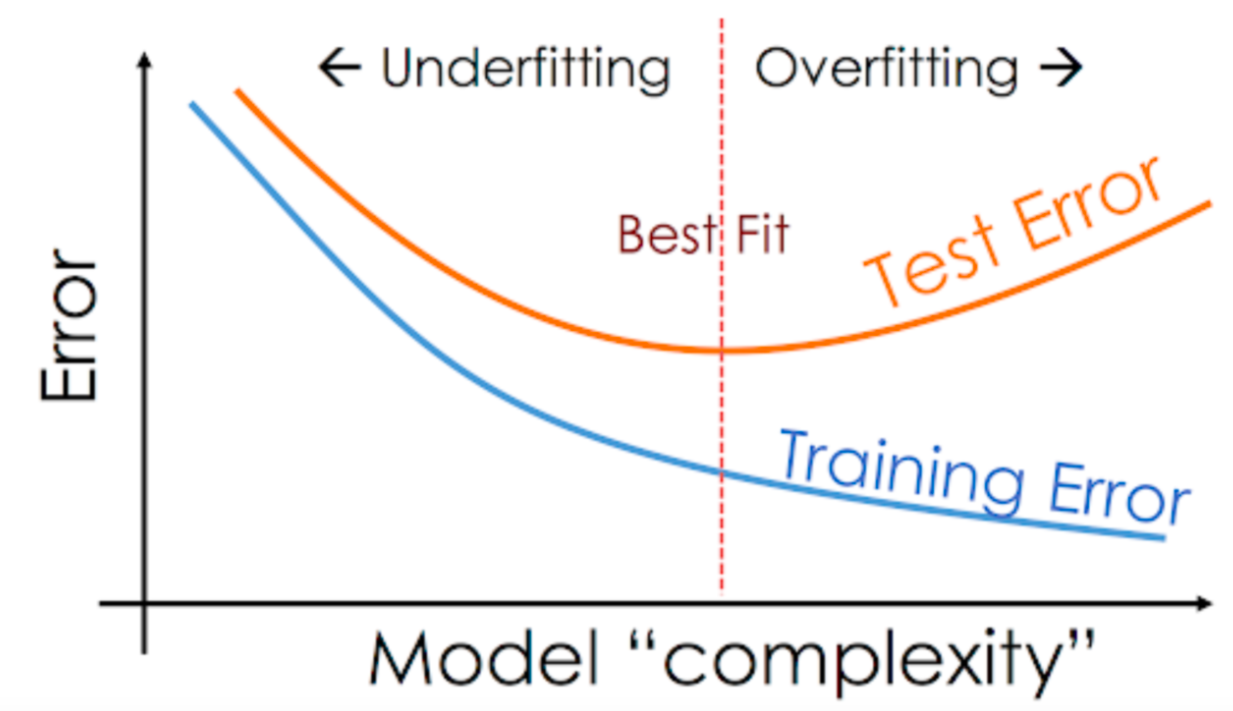
Overfitting in Predictive Models
Why is overfitting important?
We always look at prediction error when build a prediction model. Prediction error can be explained by bias + variance errors.
Bias: the difference between the forecast ($\hat{y}$) and the actual ($y$) that we are trying to predict.Variance: the variability of the forecasted value and gives an estimate of the spread of the model data.
Underfitting: high bias, low variance.Not able to capture the trend of data, happen due to insufficient data or too few features. ...
JHU NLP CS 601-671 Notes Collection
Below are the notes I take from CS 601-671 course for NLP: self-Supervised Models.Time I toke: 2024 Spring.
Connecting Language to the World
NLP-Connecting Language to the World
connect vision - language
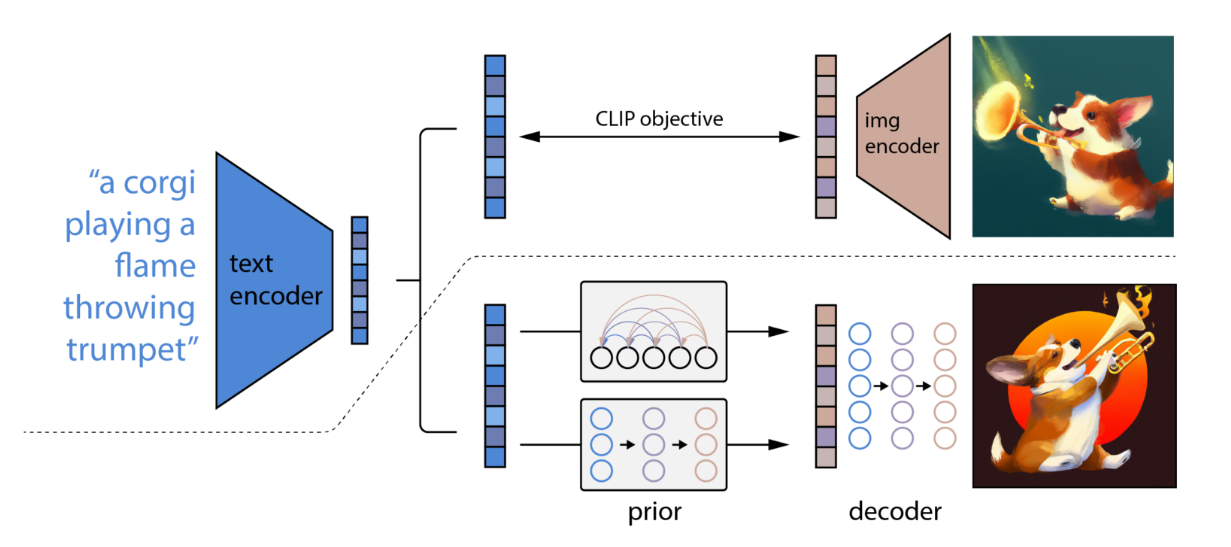
generative vision-language model
others[speech, audio]
from language to code
from language to action
1.connect vision - languageHistory1960s first cv project.2000s shallow classifiers and feature engineering.2012 deep learning revolution. CNN in ImageNet. unification of architectures. Rise of image generation (VAEs, GANs, etc.).2020s eras of vision transformer.
How to encode images?Vision Transformers (ViT). Image to patch(matrices, e.g. you have differen ...
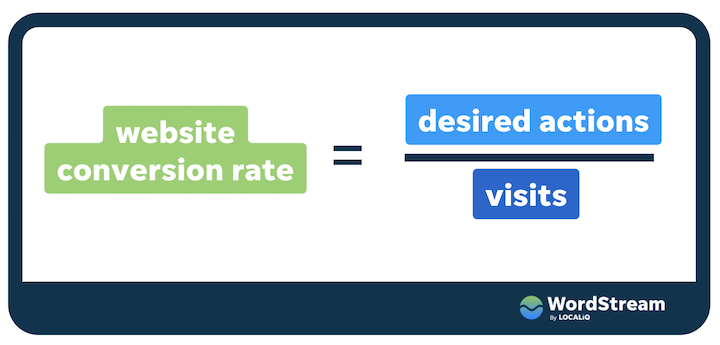
01-Conversion Rate
Since the courses are needed to be purchased to get the dataset, I will study all the projects in this series from JifuZhao who shared the relative ipynb works on github. Reference link for this one: https://github.com/JifuZhao/DS-Take-Home/blob/master/01.%20Conversion%20Rate.ipynb
Some usual structure for data analysis works:
1 State the Issues/Target
2 Collect the Data
3 Data cleaning and preprocessing
4 Do the Exploratory Data Analysis
5 Feature Engineering
6 Build Model to Solve the Issue
7 ...
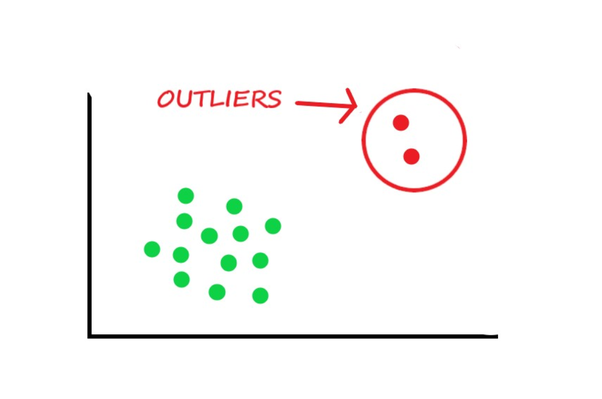
Some Applied Statistics Notes about Outliers
From JHU AMS class EN.553.613 ASDA 2023 Fall.
Notice Outliers:
Plot residuals($e_i=y_i-\hat{y_i}$) vs. $X$ or $\hat{y}$
box plot
dot plot
stem plot
If > 4|$e_{i}^{*}$|, where
$e_{i}^{*}=\frac{(e_i-\bar{e})}{\sqrt{MSE}}=\frac{e_i}{\sqrt{MSE}}=semistudentized\;residuals$, where
$MSE=\frac{SSE}{n-p}=\frac{\sum_{i=1}^{N}(y_i-\hat{y_i})^2}{n-p}$, where
p is the number of the estimators.
We have
$var(ei)=\theta^2(1-h{ii})$,
$cov(ei, e_j)=-\theta^2h{ij}$,
$h_{ij}=X_i(X^TX)^{-1}X_j^T$,
$h_{ii}(leve ...


